

1. Multi-Variable Crossplots & Advanced Drilling Analytics
Diagnosing complex drilling dysfunctions, optimizing drill bit cutting mechanics, detecting formation pressure changes, and classifying petrophysical rock facies require examining relationships between multiple parameters simultaneously. Standard 2D strip charts cannot reveal non-linear dependencies between mechanical energy, hydraulics, mud rheology, and lithology.
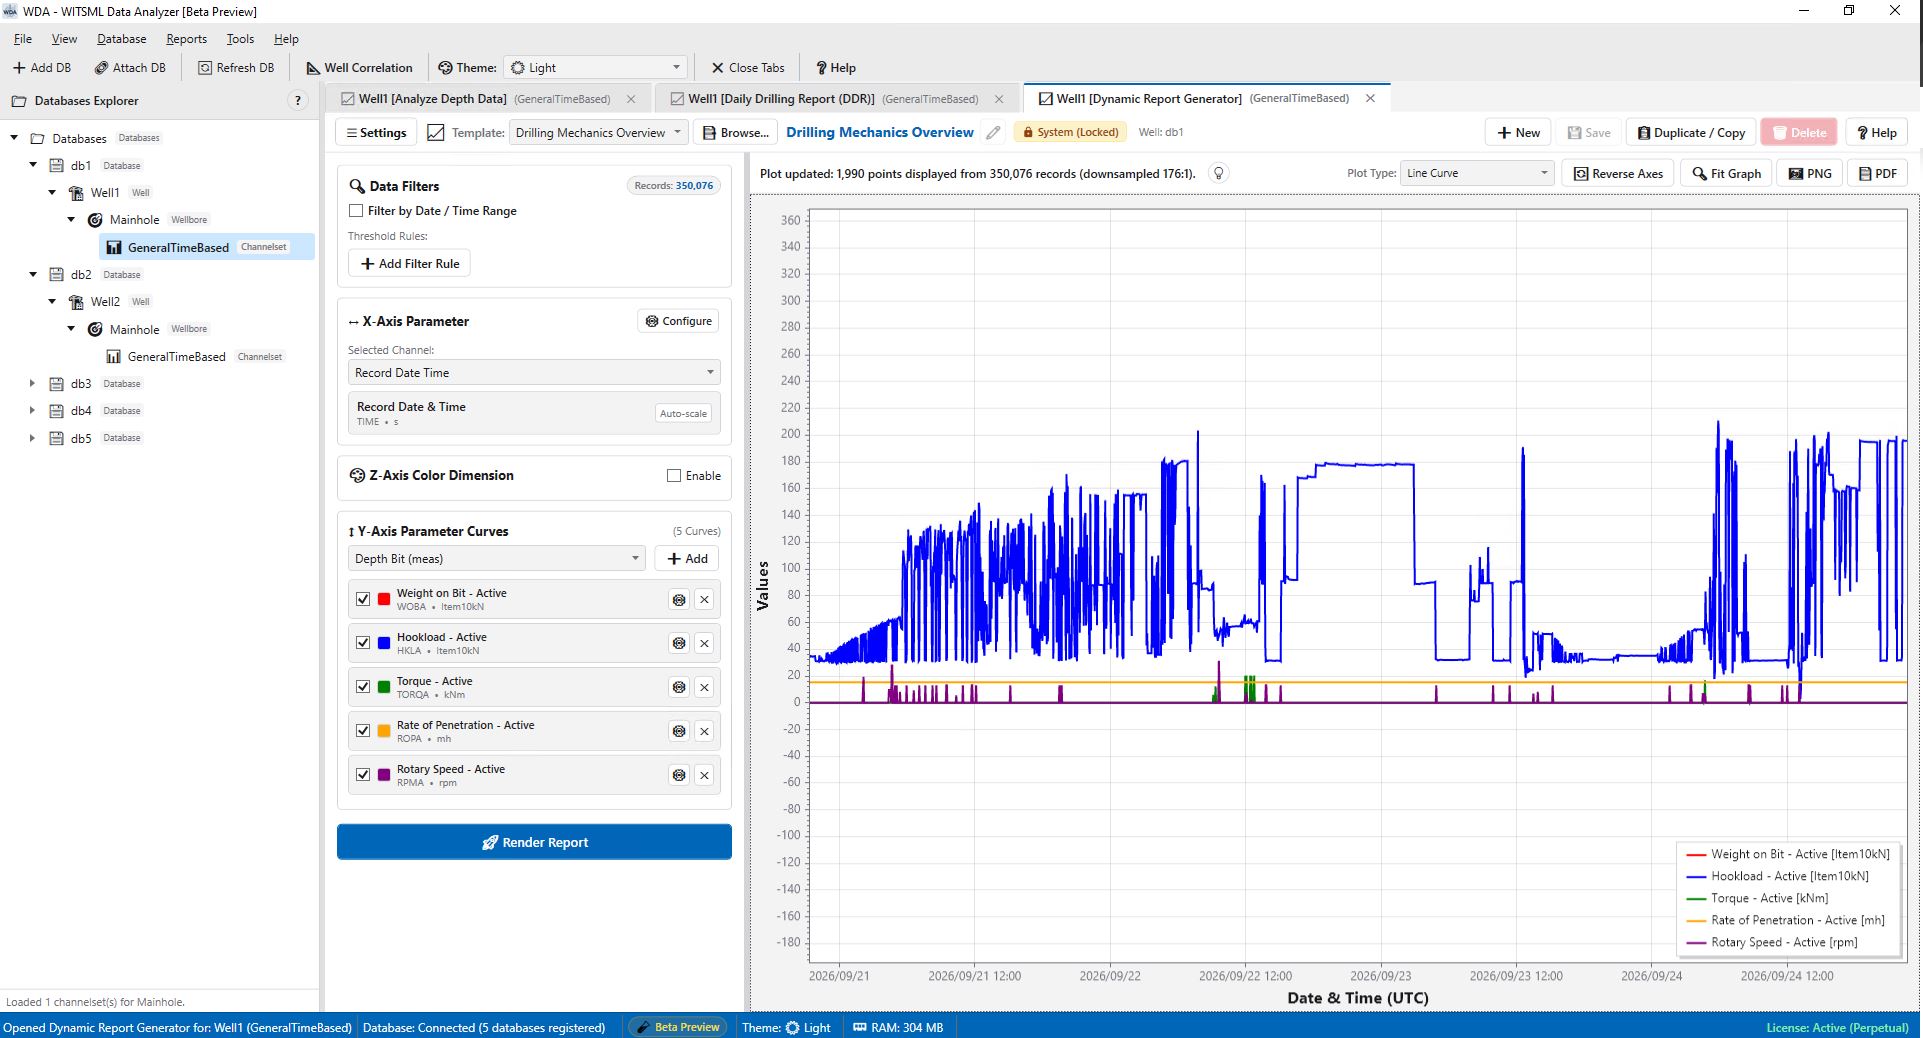
The WDA Dynamic Report Generator (accessed directly from the Databases Explorer tree by right-clicking any Channelset and selecting Reports > Dynamic Report Generator) is an interactive analytical crossplotting and composite report environment. Built on high-performance vector graphics, it allows drilling engineers and petrophysicists to correlate multiple variables, apply complex compound filter rules, map a third data dimension using 3D Z-axis colormaps (Viridis, Turbo, Plasma), flip axis orientations with zero lag, and leverage an extensive built-in library of 47 pre-calibrated system templates for instant well analysis.
2. Comprehensive Library of 47 Predefined System Reports
Rather than forcing engineers to configure complex plots from scratch, WDA comes pre-packaged with a vast library of 47 industry-standard system reports embedded directly in the application database. These reports are locked against accidental overwrite to ensure benchmark integrity, but can be duplicated with a single click to create custom, tailored reports:
A. Drilling Mechanics, Dynamics & Bit Optimization
- 1. Drilling Mechanics Overview: Real-time monitoring of surface mechanical energy, hookload dynamics, torque, rotary speed, and rate of penetration.
- 4. Bit Dysfunction Cross-Plot (WOB vs. Torque): Parameter-versus-parameter scatter analysis diagnosing bit efficiency, cutter wear, and stick-slip vibrations.
- 11. Mechanical Specific Energy & Drill-Off Cross-Plot: Cross-plots ROP and MSE directly against Weight on Bit to identify the rock founder point and cutter dulling.
- 15. Top Drive vs. Rotary Table Power & RPM Distribution: Evaluates rotational power distribution and speed differentials between top drive and rotary table to isolate torque losses.
- 23. Drillstring Fatigue & Cumulative Bit Revolutions Profile: Tracks cumulative string revolutions and rotating hours over footage to monitor tubular fatigue and bearing wear.
- 24. Peak Dynamic Load & Rig Mechanical Safety Margins: Evaluates maximum instantaneous hookload, WOB, and torque spikes against moving averages to detect impact loading and bit bounce.
- 30. Torque & Drag Broomstick Profile: Tracks buoyed drillstring weight, pick-up weight, slack-off weight, and rotating off-bottom hookload against depth to identify tight spots and keyseats.
- 33. Drill-Off Test Founder Point & ROP Response Cross-Plot: Evaluates instantaneous ROP against incremental WOB with RPM color-coding to determine optimal drilling parameters.
- 36. BHA Mechanical Shock & Dynamic Torsional Vibration Audit: Compares instantaneous dynamic shock loads against average drilling parameters to diagnose torsional stick-slip and axial bit bounce.
- 39. Downhole Mud Motor / Turbine vs. Surface String RPM Partition: Compares positive displacement motor (PDM) downhole bit speed against surface rotation to evaluate motor efficiency and stall risk.
- 40. Bit Dull Life Progression & Cumulative Energy Dissipation Log: Maps cumulative mechanical work and bit revolutions against depth to predict cutter degradation before pull-out.
B. Well Control, Hydraulics & Kick/Loss Early Warning
- 2. Hydraulics & Well Control (Kick / Loss Monitor): Real-time monitoring comparing standpipe pressure, active pit volumes, and return flow to identify kicks or lost circulation early.
- 10. Mud Pump Stroke Dynamics & SPM Performance: High-resolution stroke rate monitoring tracking individual triplex mud pumps (SPM1, SPM2, SPM3) and pressure pulsations.
- 17. Swab & Surge Dynamic Margin Monitor: Evaluates dynamic surge and swab pressure variations against pore and fracture gradients during pipe movement.
- 18. Precision Surface Flow & Mass-Balance EWS: Monitors micro-flow differentials between mud inflow and outflow to detect early influxes or fluid losses during connections.
- 22. Managed Pressure Drilling & Choke Pressure Envelope: Monitors surface backpressure, casing/choke manifold pressure, and standpipe pressure to verify bottomhole pressure containment during MPD operations.
- 31. Wellbore Hydraulics & Annular Pressure Loss Profile (ECD vs. True Depth): Profiles Equivalent Circulating Density (ECD), static mud weight, and circulating friction against depth to maintain wellbore stability.
- 34. Total Volumetric Mud Pump Efficiency & Stroke Delivery Balance: Tracks cumulative stroke count, volumetric displacement, and total surface SPM against flow in to audit pump liner volumetric efficiency.
- 38. Real-Time Delta-Flow Kick & Loss EWS Signature: Correlates flow rate differentials with pit levels and choke pressure to trigger immediate kick alarms before pit overflows.
C. Mud-Logging Gas Chromatography & Formation Evaluation
- 3. Hydrocarbon Gas Chromatogram Analysis (C1 - C5): Continuous monitoring of total background gas alongside individual chromatographic species (Methane through Pentanes).
- 7. Advanced Gas & Heavy Hydrocarbon Evaluation: Evaluates wetness ratio, balance ratio, and character ratio (Wh, Bh, Ch) for real-time hydrocarbon fluid typing and pay zone identification.
- 9. Depth-Based Formation Evaluation Log: Stratigraphic composite profile plotting ROP, Mechanical Specific Energy, total hydrocarbon gas, and corrected dc exponent against Measured Depth.
- 13. Extended Hydrocarbon Gas & Aromatics Characterization: Heavy hydrocarbon characterization tracking C1-C5 components alongside Hexane, Heptane, Octane, Benzene, and Toluene to identify gas-oil contacts.
- 16. Mud Lag & Bottoms-Up Circulation Roadmap: Tracks lagged formation depth, stroke lag, and travel times against bit depth to verify cutting sample catching accuracy.
- 26. Historical Mud Pump Lag & Sample Depth Log: Retroactively maps time-series surface gas readings to true formation depth (LAGDEPT) using dynamic annular pump stroke models.
- 35. Formation Hydrocarbon Fluid Typing Log: Maps light and heavy hydrocarbon species alongside non-hydrocarbon CO2 against true lagged formation depth for reservoir fluid characterization.
- 41. Aromatic BTEX & Condensate Maturity Log: Evaluates aromatic hydrocarbons (Benzene, Toluene) and heavy alkanes to determine thermal maturity and detect reservoir water washing.
- 43. Mud Lag & Bottoms-Up Circulation Cycle Log: Calibrates annular sample travel times and pump stroke counts against depth to verify cuttings and gas lag calculations.
D. Pore Pressure, Geomechanics & Compaction Trend Diagnostics
- 5. Pore Pressure & Trend Diagnostics (dc Exponent & ECD): Evaluates drillability d_c exponent and Equivalent Circulating Density against depth to detect transitions into overpressured shales.
- 19. Compaction Trend & Pore Pressure Departure: Plots d-exponent, corrected dc-exponent, and ECD against depth to identify pore pressure departure from normal compaction trends.
- 28. Post-Well Engineering Diagnostics: Detailed post-well review combining mechanical drilling efficiency (MSE), pore pressure departure (dc-exponent), and hydrocarbon gas ratios.
- 42. Normal Compaction Trend Departure (d-Exponent vs. dc-Exponent Log): High-resolution depth profile comparing raw d-exponent with mud-weight corrected dc-exponent and ECD.
E. Mud Thermodynamics, Pit Distribution & Solids Control
- 8. Mud Temperature & Circulation Thermodynamics: Tracks mud inlet and outlet temperature differentials and mud weight to evaluate geothermal gradients and thermal influxes.
- 12. Mud Conductivity & Solids Control Monitoring: Monitors drilling mud electrical conductivity and degassing efficiency across desander, degasser, and desilter processing.
- 14. Active Mud Pit Distribution & Pit Volume Balance: Continuous monitoring of volume distribution across active suction, intermediate, and reserve pits to maintain surface volume stability.
- 20. Full Surface Solids Control & Degasser Equipment Log: Monitors volume processing across desanders, desilters, vacuum degassers, and centrifuges to audit solids separation efficiency.
- 32. Geothermal Gradient & Circulating Mud Thermodynamics: Profiles circulating mud temperatures and conductivity against depth to detect formation water influxes.
- 45. Surface Mud Tank System & Reserve Compartment Distribution: Provides a compartment-by-compartment breakdown across active, slug, and reserve tanks over time.
- 46. Solids Control Mechanical Processing & Degasser Efficiency: Audits mechanical solids removal efficiency and vacuum degassing performance during heavy drilling stands.
F. Tripping Operations, Flat-Time Optimization & Field Benchmarking
- 6. Tripping & Hole Fill Monitor: Monitors trip tank displacement, hookload variations, bit depth, and overpull while pulling out of or running into the borehole.
- 25. Dual Trip Tank Displacement & High-Precision Swab Audit: Monitors dual trip tank capacities and slug pit volumes during high-angle tripping to prevent swabbing in tight clearance sections.
- 27. Post-Drilling Rig-State & Activity Timeline: Displays automated operational state classifications (Rotary Drilling, Slide Drilling, Tripping, Connections, Reaming) alongside key mechanical parameters for flat-time analysis.
- 29. Multi-Well Offset Benchmarking Roadmap (P10 / P50 / P90 Envelopes): Overlays active well parameters against offset field history percentiles to benchmark ROP, WOB, Torque, and MSE against statistical boundaries.
- 37. Pipe Movement & Slips-to-Slips Connection Dynamics: Correlates traveling block position, hookload status, and pump ramp-down during pipe additions to evaluate connection flat-time and drill crew efficiency.
- 44. Trip Sheet Displacement Verification & Swab/Surge Audit: Verifies theoretical steel displacement against actual trip tank volume changes during pipe tripping.
G. Rig Safety & Multi-Location Gas Detection Networks
- 21. Multi-Location H2S & Combustible Gas Safety Network: Multi-point environmental safety log monitoring toxic H2S and combustible gas (LEL) levels across all rig sensors (rig floor, shaker, substructure, gas line).
- 47. Spatial Rig Floor H2S & Combustible Gas (LEL) Explosion Safety Matrix: Aggregates physical H2S toxicity and combustible LEL sensors across the drill floor, substructure, shaker house, and flowline over time to pinpoint gas migration and trigger alarms.
3. 3D Z-Axis Colormaps & Flexible Visualizations
WDA transforms standard 2D scatter plots into dense 3-dimensional analytical visualizations:
-
Z-Axis 3D Color Dimension:
Color-map individual scatter points according to a third continuous variable. For example, plot ROP vs Weight on Bit (WOB) color-coded by Total Mud Flow Rate or Gamma Ray to immediately isolate whether drilling rate drops are caused by bit balling, hydraulic cleaning limits, or lithology transitions into hard carbonate stringers. -
Perceptually Uniform Colormap Palettes:
Select from industry-standard colormaps including🌿 Viridis(colorblind-accessible, ideal for publication),🌈 Turbo(high-contrast rainbow for anomaly detection),🔥 Plasma, and🌋 Magma. -
Multiple Visual Modes (Line, Scatter, Bar):
Toggle instantly between continuous connected Line curves, discrete bivariate Scatter crossplots, and vertical Bar histogram distributions. -
Instant Reverse Axes:
With a single click, flip chart orientation between a Horizontal Strip Chart (Time/Depth along X-axis) and a Vertical Well Log Track (Time/Depth along inverted Y-axis).
4. Interactive Filter Algebra & Operational Slicing
Isolate clean, representative drilling states using the sidebar filtering engine:
-
Real-Time Matching Record Counter: An instant badge reports the exact count of filtered data points matching current conditions (e.g.
Records: 48,250). -
Temporal Window Bounding: Narrow analysis to a specific bit run, drilling stand, circulation check, or crew shift using integrated calendar DatePickers and
hh:mm:ssUTC inputs. -
Compound Parameter Boundaries: Filter by multiple channels simultaneously using relational operators (
>,>=,<,<=,=,!=,Between). Isolate true on-bottom drilling (e.g.,[WOB] > 8 klbf AND [RPM] > 70 rpm AND [SPP] > 2200 psi) without noise from pipe connections.
5. Portable Report Templates (.wdareport) & Enterprise Sharing
Standardize crossplot configurations across teams without sending massive, confidential well data files:
-
System Baselines vs. Custom Templates:
WDA comes equipped with locked System Templates representing standard industry workflows. ClickDuplicateto create custom, unlocked reports tailored to specific reservoirs or drilling contractors. -
Lightweight .wdareport Portability:
Export any custom template to a lightweight.wdareportfile (typically < 10 KB). These files contain only layout geometry, channel mappings, color scales, and filter rules—never raw proprietary data—making them 100% safe for email distribution across asset teams. -
Import with Schema Protection:
Importing templates checks specification versions and automatically resolves naming collisions, ensuring existing reports are never overwritten.
6. High-Resolution Publishing & Graphic Export
Generate high-resolution deliverables for technical papers, end-of-well reviews, and executive morning decks:
- Vector PDF Reports: Print publication-ready vector composite logs that retain crisp typography and sharp curve lines at any magnification.
- High-Resolution PNG / JPEG: Export lossless raster graphics ready for PowerPoint decks and technical well recaps.
- Raw Filtered Data Export: Export the underlying filtered data points directly to Microsoft Excel or CSV for external statistical modeling.
7. Related WDA Engineering Modules
- WDA: WITSML Compatible Data Analyzer: Explore WDA's high-speed architecture and integrated wellbore tools.
- Time-Based Analysis Console: Inspect chronological sensor telemetry with the 15-parameter strip chart.
- Depth-Based Log Analysis & Petrophysics: Display continuous petrophysical depth tracks with lithology shading.
- Daily Drilling Reports (DDR): Generate certified 24-hour IADC tour sheets and operational logs.
The WDA Dynamic Report Generator delivers the visual flexibility, pre-calibrated engineering depth, and mathematical rigor required to uncover deep operational insights from complex wellsite data.